3.2 Incidents in the survey application
Specific events associated with the implementation of the 2016, 2017, 2018, 2019 and 2021 waves are detailed below:
3.2.1 2016 Wave Implementation
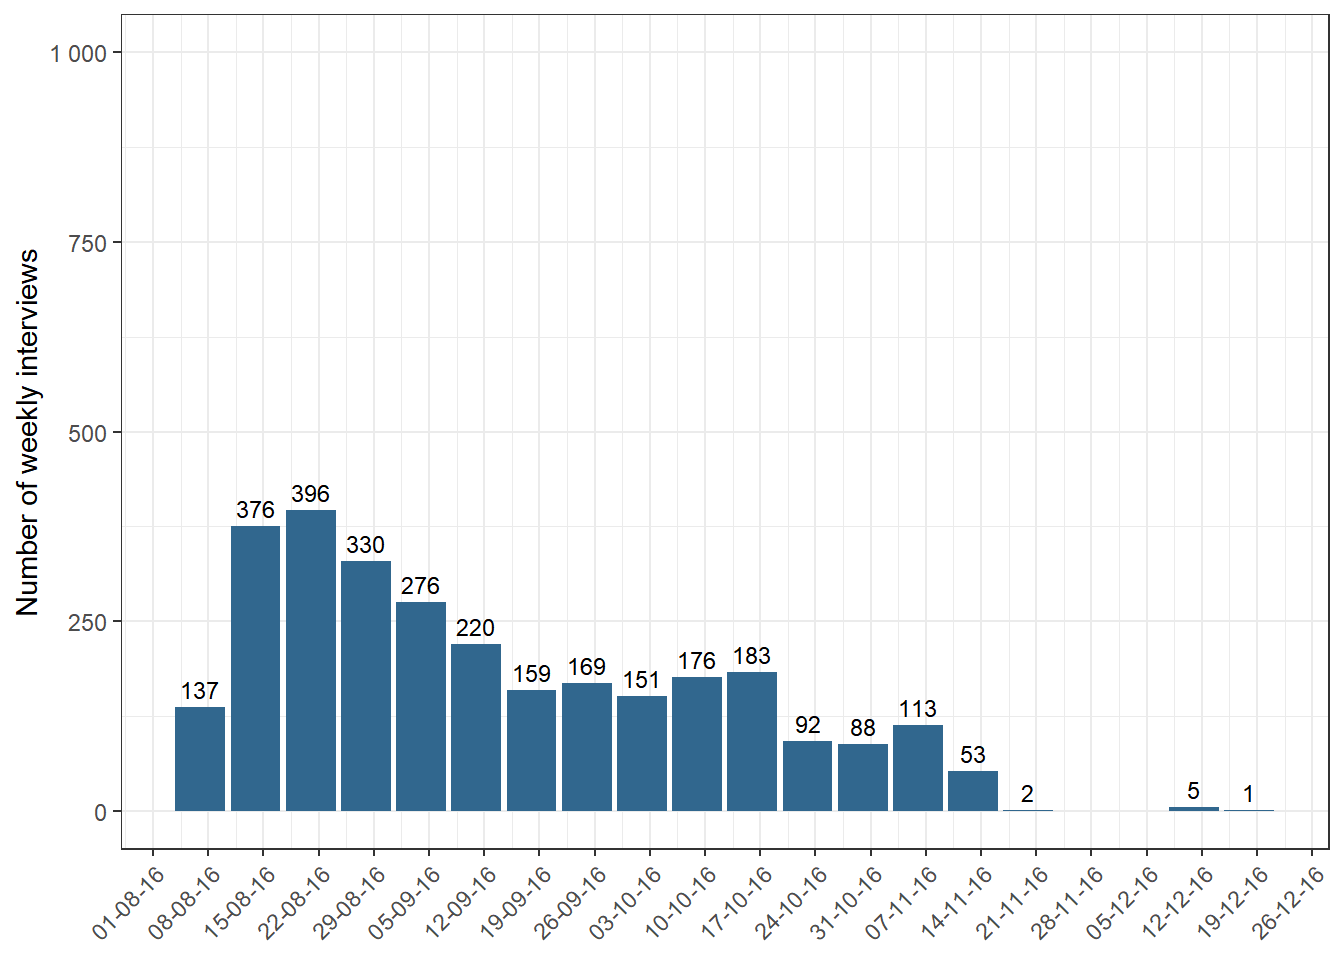
The survey implementation lasted over 20 weeks, from August to December 2016 (see Figure 3.1). We distributed 132 interviewers in 4 work sites for the field implementation, each one led by a trained group coordinator.
The period was more extended than initially predicted (we estimated it to last between 8 and 12 weeks, but we finally extended it to 20 weeks). The main difficulties encountered and the measures adopted to solve the events were as follows:
In its technical proposal, the CMD committed to a fieldwork period of 8 weeks. This time estimate was based on recent studies but was inadequate given the difficulties in accessing the sample and its dispersion.
The biggest problem occurred in the Metropolitan Region, which, unlike the other regions, did not consider an oversized sample according to historical response rates in household surveys with a random selection of interviewees. We expanded the sample to solve this problem (see Stage 5: Increasing the sample size for more details), which resulted in an additional survey period.
We encountered difficulties in recruiting and retaining interviewers for the project due to the problem of accessing the sample and its dispersion, which made the proposed payment to the interviewers, compared to other parallel projects (inside and outside the Center), relatively less attractive. To solve this problem, we gradually increased the amount paid and the flexibility provided to the interviewers.
CMD accorded the final closure of the survey fieldwork in agreement with COES once the totality of the oversized sample was covered5. We closed the fieldwork with 2,984 surveys completed.
Figure 3.1: Number of weekly interviews, wave 2016
Data collection indicators
The following are the Response Rate 1 (RR1, as defined by AAPOR), Cooperation Rate 1 (COOP1), Refusal Rate 1 (REF1) and Contact Rate 1 (CON1)6
| Indicator | Original Sample |
|---|---|
| Contact Rate | 72.6% |
| Cooperation Rate | 86.0% |
| Refusal Rate | 8.9% |
| Response Rate | 62.4% |
Data correction for anomalous cases: 2016 and 2017 waves
In the context of executing the third wave of the ELSOC study (2018), we detected the falsification of a limited number of cases throughout the study in waves 2016 and 2017.
During the monitoring stage of the interviewers’ work in 2018, the Microdata Center (CMD) detected and reported that a set of cases included in the panel sample were faked.
Due to the slow progress of ELSOC’s 2018 field goals in Tarapacá and Valparaíso, they sent new interviewers and detected these problems. Specifically, they found systematically falsified surveys: conducted with different people than those included in the sample or where the interviewers requested information from third parties.
This led to an exhaustive review process, in which we detected 56 faked cases in the 2016 field and 47 in the 2017 field, concentrated in the regions of Tarapacá (11 cases in 2016 and 11 in 2017) and Valparaíso (45 cases in 2016 and 37 in 2017).
CMD’s field strategy focuses on experienced interviewers, assigning the same cases to the interviewers over time, according to the recommendation of the specialized literature. The problem focused on some specific interviewers in those areas, which they did not detect during the field supervision of the first two waves.
The fake cases represent 1.9% of the actual sample size of ELSOC 2016 (N = 2,984) and 1.9% of 2017 (N = 2,522), so we consider them to have a marginal impact at the overall level. Despite this, we decided to exclude counterfeit cases from the databases, and to generate and make available a corrected version of the 2016 and 2017 databases. We fixed the weights considering the elimination of these cases.
To avoid these problems in the future, we modified the supervision protocols, increasing face-to-face oversight and the percentage of cases supervised per interviewer. In addition, we implemented an interviewer rotation system so that the same interviewers do not collect the sample in more than one round.
3.2.2 2017 Wave Implementation
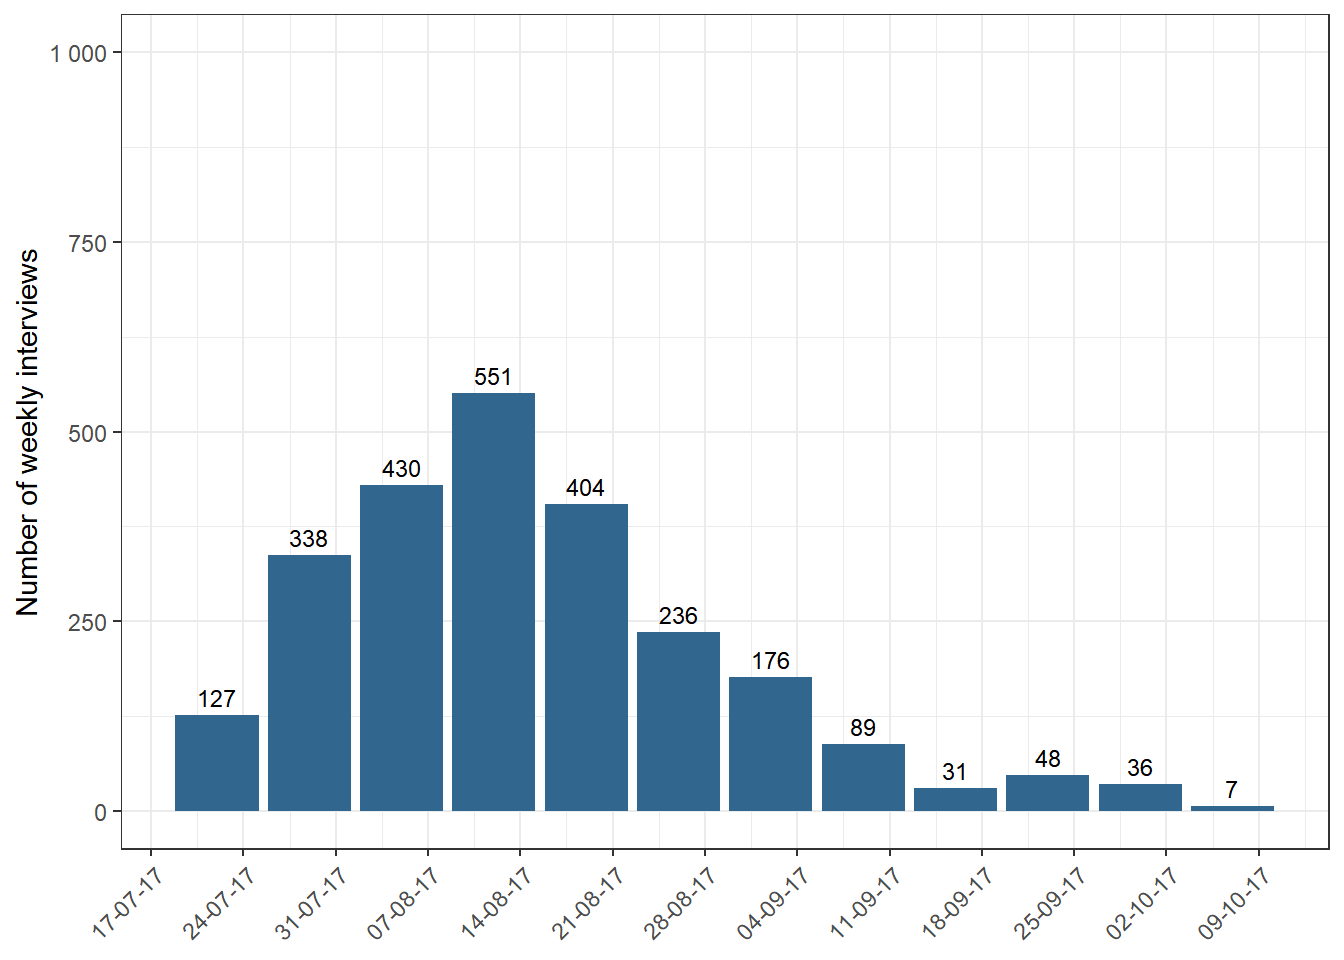
Data collection was carried out over twelve weeks, between July and October 2017 (see Figure 3.2). 120 interviewers were distributed in the 17 work sites for the field implementation.
The field lasted a more extended period than predicted, as it was estimated to last nine weeks, finally extending to twelve. However, data collection was faster than the first wave, which lasted 20 weeks. This quicker time was due to the availability of contact information for the interviewers obtained in the previous wave.
The duration of the fieldwork over the original estimate responded to how challenging it was to contact the interviewees in the Metropolitan and Valparaíso regions.
The closure of the survey fieldwork took place once the entire sample was covered. We completed the fieldwork with 2,521 surveys conducted.
Figure 3.2: Number of weekly interviews, wave 2017
Data collection indicators
The following are the Response Rate 1 (RR1, as defined by AAPOR), Cooperation Rate 1 (COOP1), Refusal Rate 1 (REF1) and Contact Rate 1 (CON1):
| Indicator | Original Sample |
|---|---|
| Contact Rate | 88.7% |
| Cooperation Rate | 93.1% |
| Refusal Rate | 6.0% |
| Response Rate | 82.6% |
3.2.2.1 Falsified cases in wave 2017
After the procedures applied by the CMD in 2018, we found and corrected anomalies in surveys conducted in 2016 and 2017. For more details of the problem and its correction, see Data correction for falsified cases: Waves 2016 and 2017.
3.2.3 2018 Wave Implementation
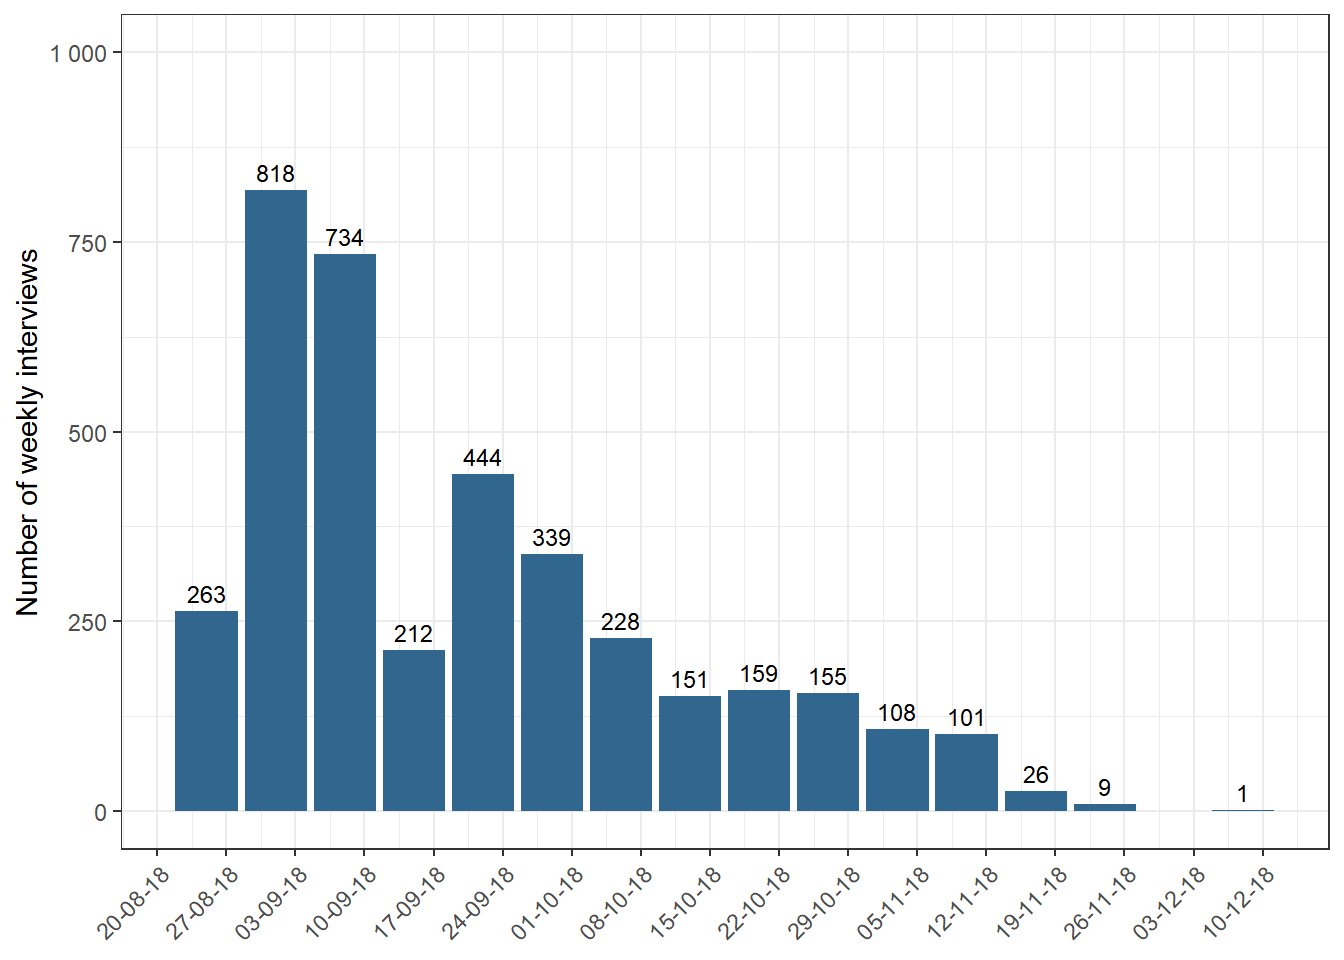
We developed the fieldwork between August and December 2018, with an estimated time (15 weeks, approximately) (see Figure 3.3). There were 189 interviewers distributed in 18 work sites to execute the fieldwork.
We included the refreshment sample during this fieldwork, which generated a difficulty for the interviewers since they had to explain and motivate the participation of families and interviewees in the study.
On the other hand, interviewees of the follow-up sample (Original sample) of 2016-2017 had contact difficulties due to a higher presence of registered address changes than in previous versions of the survey. 6.9% had moved to a different address.
Another challenge we faced in the wave is related to the fake cases detected (see Data correction for fake cases: Waves 2016 and 2017). This problem implied an exhaustive on-site review of these cases, while strengthening the control system, considering the following:
Increase the percentage of surveys monitored from 10% to 15% in 2018. This ensures the control of at least 20% of the work performed by each interviewer.
For future project waves, we defined a rotation of interviewers of the same interviewee.
Registration of the interviewers involved to avoid their consideration in future study applications. Regarding the general dynamics of the work, we created economic incentives for the interviewers to achieve the expected sample. Likewise, we arranged transport mechanisms for the interviewers to cover the entire sample on a schedule.
The survey fieldwork ended with the agreement of COES once we covered the entire sample. The fieldwork closed with 2,274 surveys in the follow-up sample and 1,523 surveys in the refreshment sample.
Figure 3.3: Number of weekly interviews, wave 2018
Data collection indicators
The following are the Response Rate 1 (RR1, as defined by AAPOR), Cooperation Rate 1 (COOP1), Refusal Rate 1 (REF1) and Contact Rate 1 (CON1):
| Indicator | Original Sample | Refreshment Sample |
|---|---|---|
| Contact Rate | 86.0% | 66.0% |
| Cooperation Rate | 93.0% | 88.0% |
| Refusal Rate | 5.0% | 8.0% |
| Response Rate | 80.0% | 58.0% |
3.2.4 2019 Wave Implementation
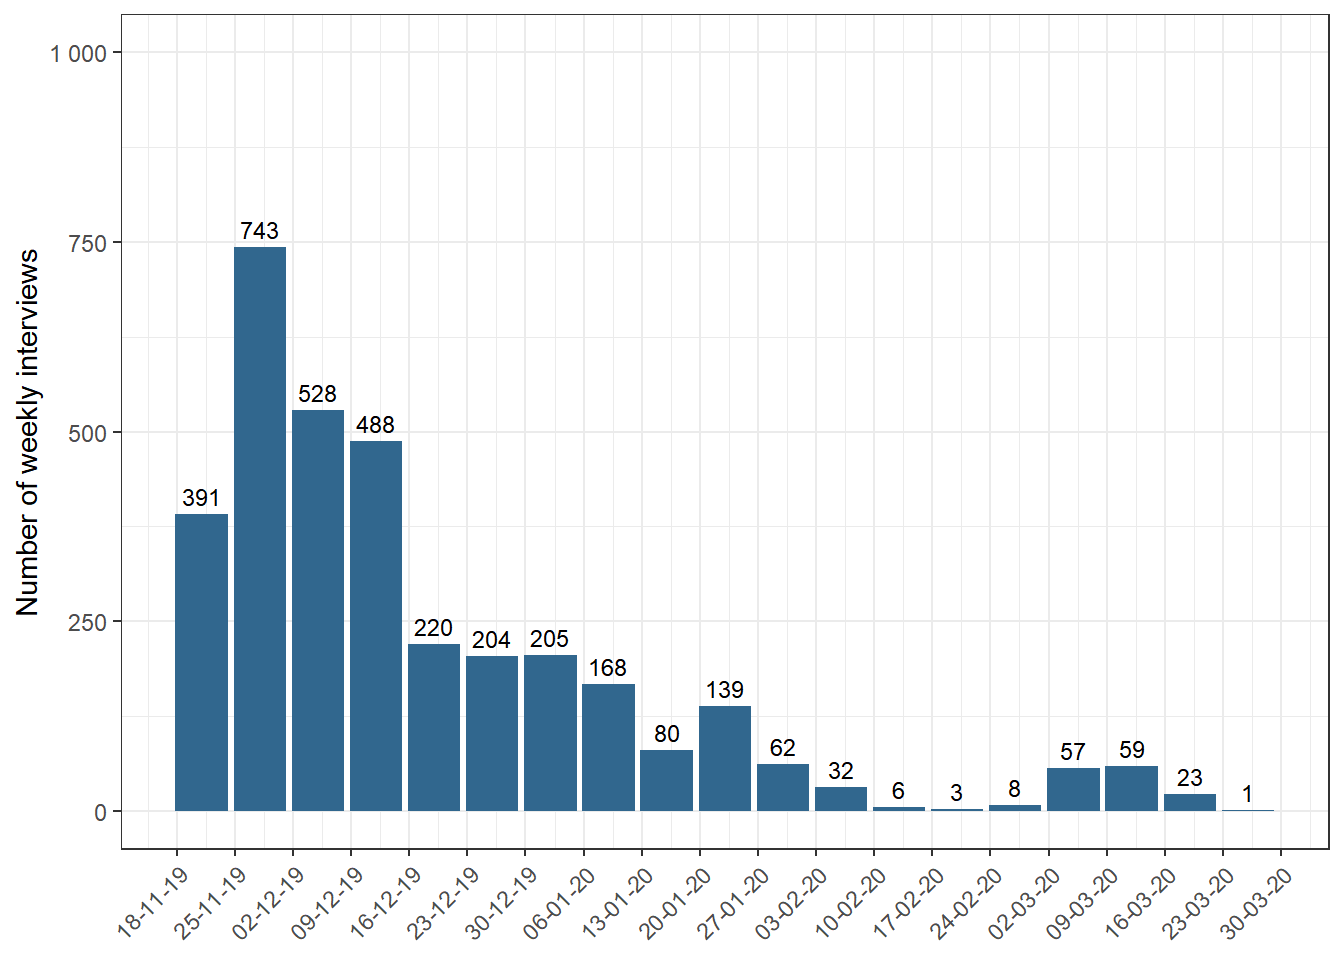
We scheduled ELSOC 2019 data collection to begin on Saturday, the 19th of October 2019. However, due to the Chilean Social Outburst that started on the 18th of October 2019, we suspended the fieldwork until Thursday, the 21st of November, when the data collection finally began. Therefore, we surveyed during the Social Outburst period, making its execution difficult.
The work lasted for 13 weeks (we decided to pause the data collection during the last three weeks of February 2020, given the exhaustion of the sample and the field team) (see Figure 3.4). There were 143 interviewers in the field, distributed in 16 work sites, administered by trained zone coordinators.
Figure 3.4: Number of weekly interviews, wave 2019
Data collection indicators
The following are the Response Rate 1 (RR1, as defined by AAPOR), Cooperation Rate 1 (COOP1), Refusal Rate 1 (REF1) and Contact Rate 1 (CON1):
| Indicator | Original Sample | Refreshment Sample |
|---|---|---|
| Contact Rate | 86.0% | 87.0% |
| Cooperation Rate | 93.0% | 95.0% |
| Refusal Rate | 5.0% | 3.0% |
| Response Rate | 80.0% | 83.0% |
3.2.5 2021 Wave Implementation
The health crisis caused by the COVID-19 pandemic and its associated restrictions implied changing the methodology of application of the survey from face-to-face to remote through a telephone survey (For more details, see Questionnaire 2021: Survey during the COVID-19 Pandemic). This change in collecting data introduced a tremendous logistical and operational challenge since ELSOC had surveyed in person since its origins.
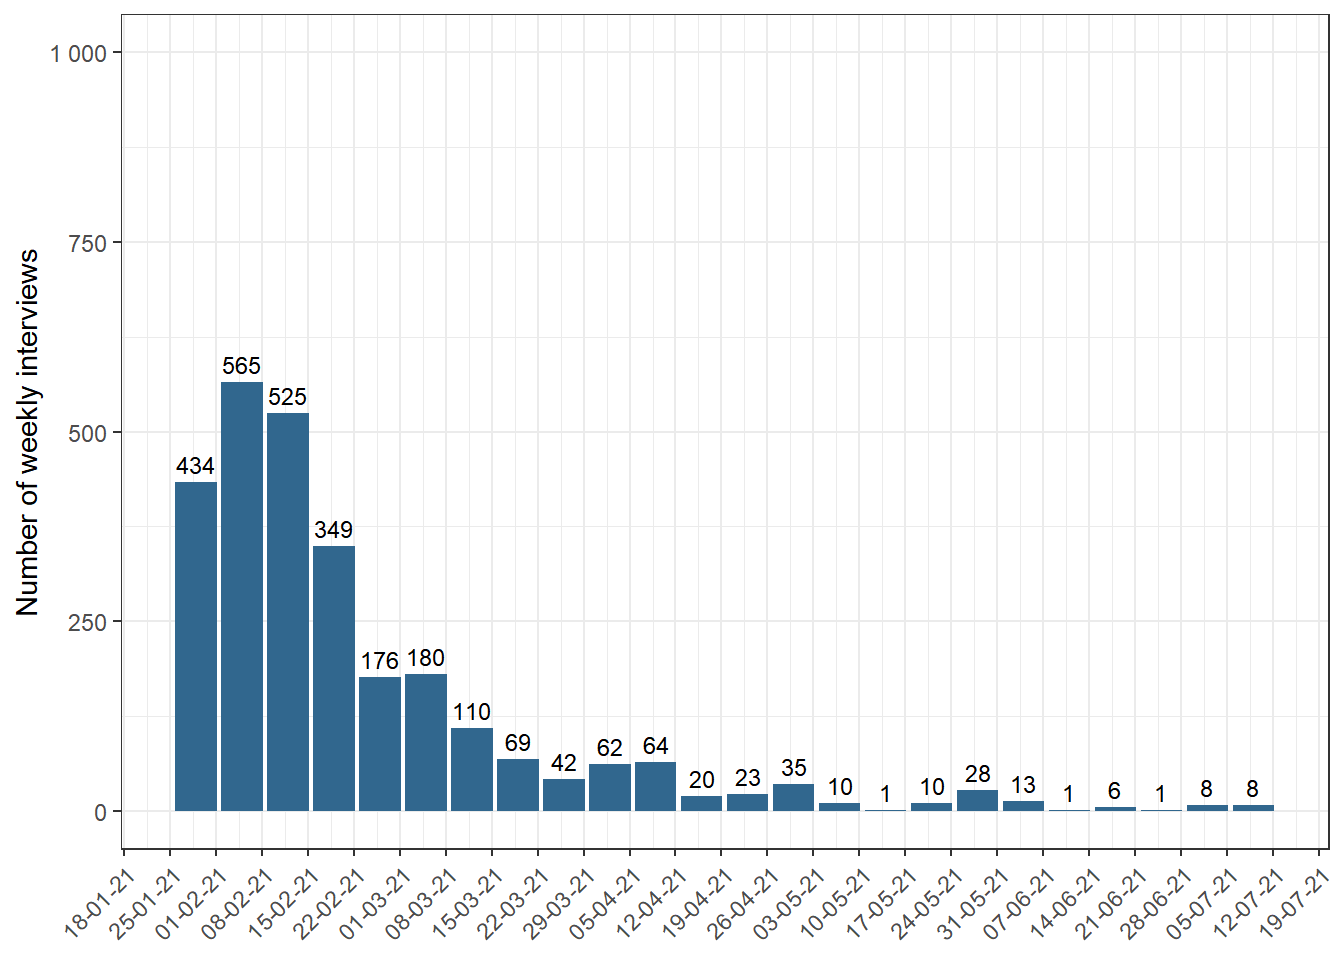
The COVID-19 pandemic also affected the traditional ELSOC survey date, which we scheduled to begin in October 2020. However, the fifth wave survey started on January 30th, 2021, with the assignment of the sample to trained interviewers. The reasons for postponing the survey period were mainly waiting for more favourable sanitary and lockdown conditions that would allow a face-to-face survey (however, it soon became apparent that it was impossible to maintain the face-to-face modality). We extended the fieldwork until mid-June 2021. Nevertheless, we carried out most surveying between February and April 2021 (see Figure 3.5).
Due to sample attrition and the deterioration of the team of interviewers given unsuccessful contact attempts, we decided to change the application methodology per sampling unit in May. We formed a group of interviewers dedicated exclusively to reviewing the sample on a given working day.
Figure 3.5: Number of weekly interviews, wave 2021
Data collection indicators
The following are the Response Rate 1 (RR1, as defined by AAPOR), Cooperation Rate 1 (COOP1), Refusal Rate 1 (REF1) and Contact Rate 1 (CON1):
| Indicator | Original Sample | Refreshment Sample |
|---|---|---|
| Contact Rate | 78.0% | 87.3% |
| Cooperation Rate | 83.7% | 76.1% |
| Refusal Rate | 11.0% | 8.8% |
| Response Rate | 65.2% | 66.5% |
Although it is required to achieve the greatest number of successful interviews, it is necessary to specify a cut-off point due to the impossibility of establishing contact or achieving a response from the household/interviewee↩︎
For more information on the identification of case disposition codes and calculation of outcome rates, see AAPOR (2016). Standard Definitions. Final Dispositions of Case Codes and Outcome Rates for Surveys↩︎